Sandy Bridge Performance Review- Relatively Affordable, Absolutely Fast (For Now, at Least)
Test Platform
We used the following hardware combination in our Sandy Bridge performance testing. Some other processors are also included for comparison purposes:
- Sandy Bridge Processors : Intel Core i7 2600K; Core i5 2500K; Core i5 2500
- Other Processors : Intel Core i7 930;Core i7 875K; Core i5 661; Core i5 655K; AMD Phenom II X6 1100T BE; Phenom II X4 975 BE; Phenom II X4 970 BE
- Motherboards : Intel DP67BG (P67); Intel DH67BL (H67); Gigabyte X58A-UD3R (X58); Gigabyte P55A-UD3P (P55); Gigabyte H55N-USB3 (H55); Gigabyte 890GPA-UD3H (890GX)
- Graphics cards : Intel HD Graphics 2000/3000; MSI N450GTS Cyclone 1GD5
- Memory : 2×1GB Kingston KHX16000D3T1K3/3GX
- Storage : 2x Kingston SSDNow VSeries 30 GB (not configured in RAID) Solid State Disk
- Power Supply : Antec TruePower 750 Watt
- Monitor : Philips 221E
- Input Devices : Genius (Keyboard and Mouse)
- OS : Windows 7 Ultimate 32-bit
- Drivers : Intel INF Driver 9.2.0.1015; Catalyst 10.11; Forceware 260.99
Test Results
Processor Performance
Blender 2.49b
Blender is an open-source 3D-modelling software. Performance is measured through the amount of time needed to render a 3D object. Lower figures represent better results.
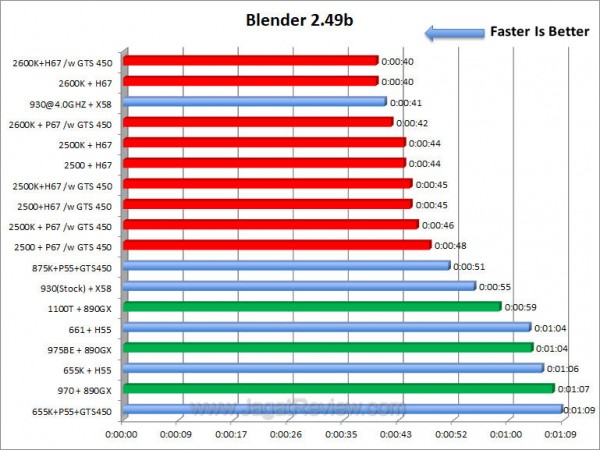
- (Intel Core i7 2600K, Core i5 2500K, Core i5 2500=Red Bars)
- (Intel Core i7 930, Core i7 875K; Core i5 661; Core i5 655K=Blue Bars)
- (AMD Phenom II X4 975 BE; Phenom II X4 970 BE; Phenom II X6 1100T=Green Bars)
All Sandy Bridge processors occupy the top positions in this test. However, our 4-GHz Core i7 930 (based on the older Nehalem architecture) managed to steal the 3rd spot.
Cinebench 11.5
Cinebench benchmark calculates hardware performance based on a 3D scene rendering. The final results are measured in points. Higher points mean better performance.
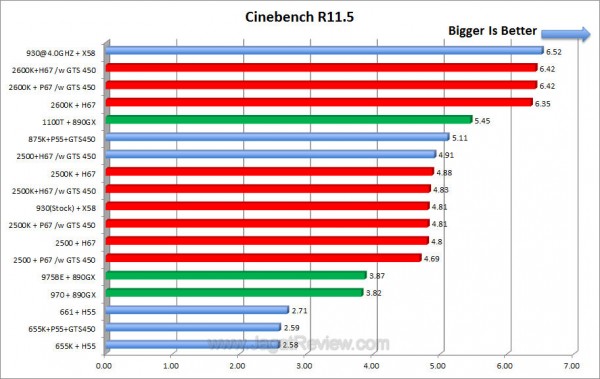
- (Intel Core i7 2600K, Core i5 2500K, Core i5 2500= Red Bars)
- (Intel Core i7 930, Core i7 875K; Core i5 661; Core i5 655K=Blue Bars)
- (AMD Phenom II X4 975 BE; Phenom II X4 970 BE; Phenom II X6 1100T=Green Bars)
With its 4-GHz frequency, our overclocked Core i7 930 is the fastest in this particular test. But, while the Nehalem has to be pumped up to 4 GHz, the Core i7 2600K needs only its default speed to occupy the second rank. Surprisingly enough, AMD Phenom II X6 1100T BE secures itself between the Core i7 2600K and Core i5 2500-series.
Excel 2010 – Montecarlo
Surely you are well familiar with this popular spreadsheet application from Microsoft. Here, we see how fast each processor could finish the “Monte Carlo Simulation Table” in Excel 2010. The final scores are measured in seconds. Smaller figures indicate better results.
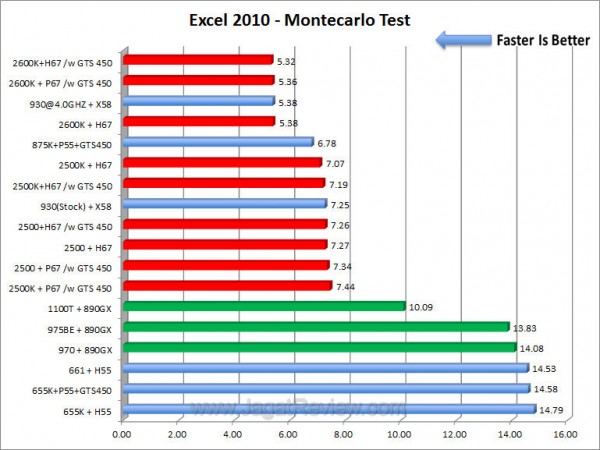
- (Intel Core i7 2600K, Core i5 2500K, Core i5 2500=RedBars)
- (Intel Core i7 930, Core i7 875K; Core i5 661; Core i5 655K=Blue Bars)
- (AMD Phenom II X4 975 BE; Phenom II X4 970 BE; Phenom II X6 1100T=Green Bars)
The Core i7 2600K stands toe-to-toe with the 4-GHz Core i7 930 in this test. The Core i5 2500-series processors are about as fast as a default-clocked Core i7 930.
FastStone PhotoResizer
FastStone PhotoResizer is an image converter/ resize software capable of applying image manipulations such as resizing, cropping, rotating, and others on multiple files through batch operation. For the purpose of this test, we convert a collection of TIFF images (66 files; 527 MB total size) to JPEG format (quality level: 90). Each of the pictures is also resized to 600 pixels on the longest side. The entire process only utilizes one processor core (thread). Therefore, processors with high clockspeeds would have a slight advantage over slower CPUs. Results are measured in the amount of time needed to finish the resizing and converting process. Lower is better.
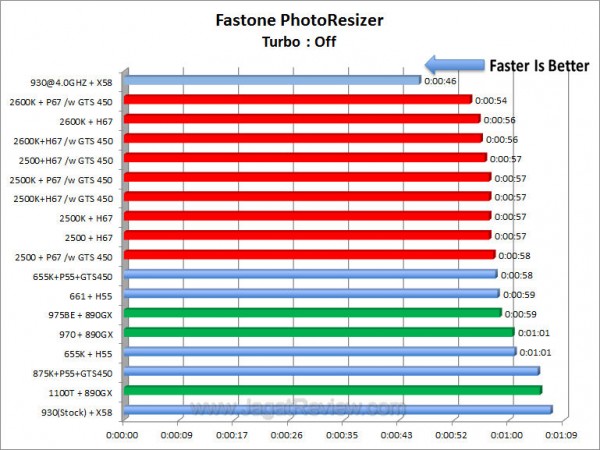
Turbo Boost / Turbo Core : Off
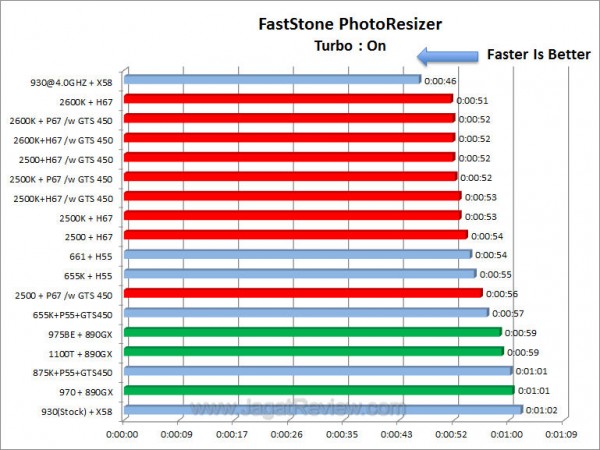
Turbo Boost / Turbo Core : On
- (Intel Core i7 2600K, Core i5 2500K, Core i5 2500=Red Bars)
- (Intel Core i7 930, Core i7 875K; Core i5 661; Core i5 655K=Blue Bars)
- (AMD Phenom II X4 975 BE; Phenom II X4 970 BE; Phenom II X6 1100T=Green Bars)
Like we had expected, in this application, the clockspeed matters more than the amount of available processor cores or threads. Turbo-boosted to 3.8 GHz, the Core i7 2600K finished second after the Core i7 930 (4 GHz). The Core i5 2500-series are right behind the Core i7 2600K.


