Sandy Bridge Performance Review- Relatively Affordable, Absolutely Fast (For Now, at Least)
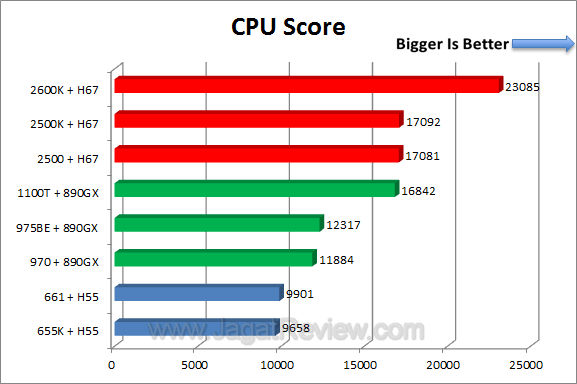
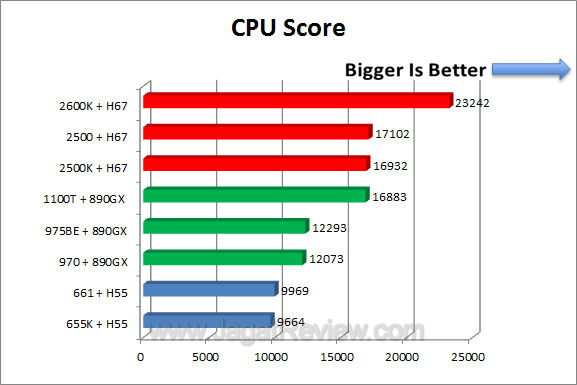
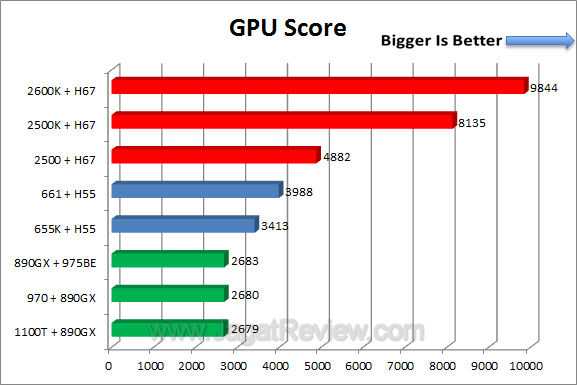
3Dmark Vantage
3D Mark Vantage is a popular, DirectX 10-based synthetic benchmark used to measure gaming performance.
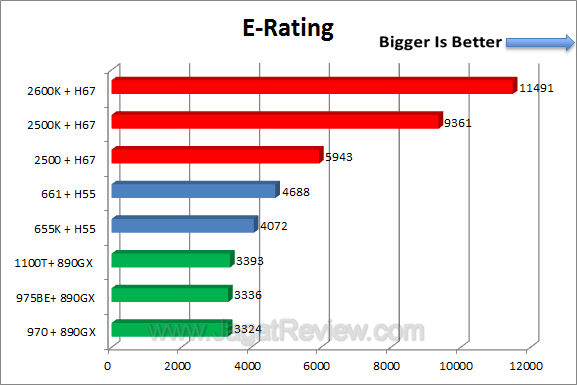
- E-Rating
- P-Rating
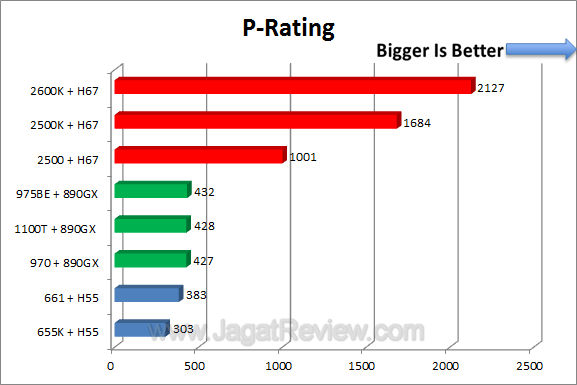
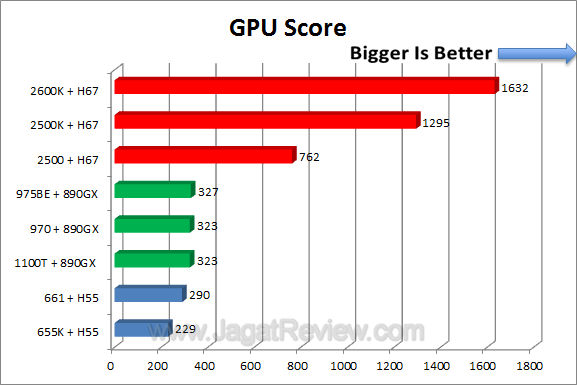
- (Intel Core i7 2600K, Core i5 2500K, Core i5 2500=Red Bars)+Intel H67
- (Intel Core i7 930, Core i7 875K; Core i5 661; Core i5 655K=Blue Bars)+Intel H55
- (AMD Phenom II X4 975 BE; Phenom II X4 970 BE; Phenom II X6 1100T=Green Bars)+AMD890GX
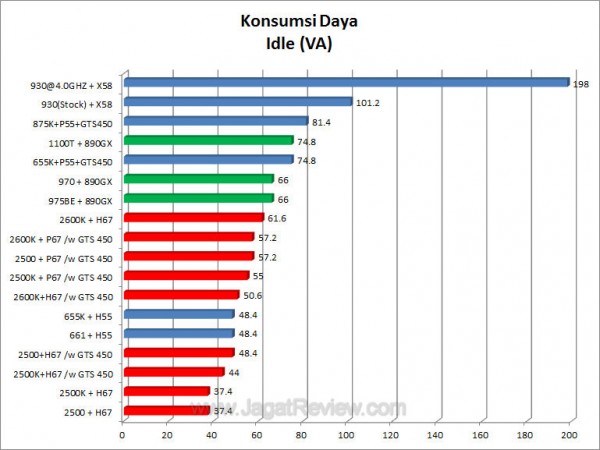
Power Consumption
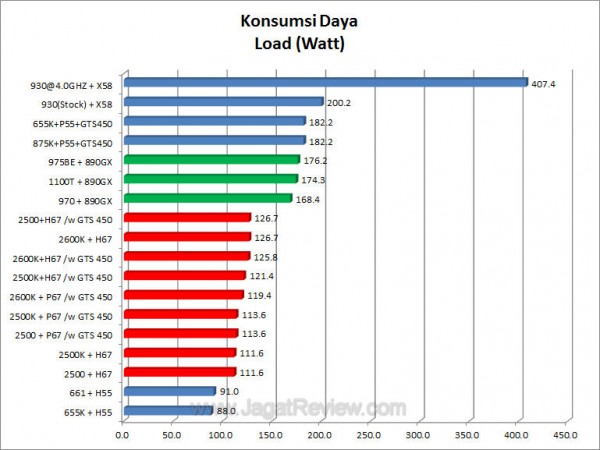
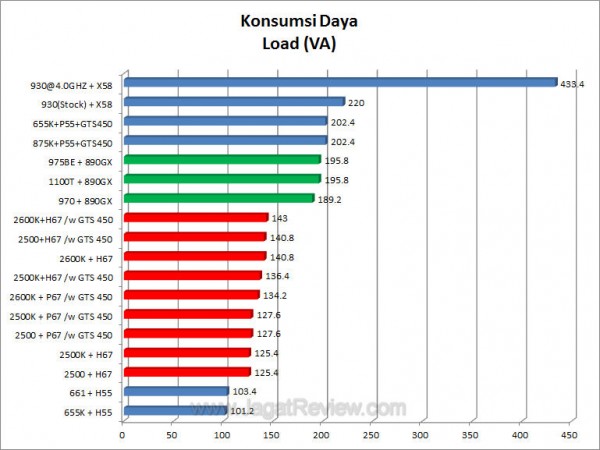
Here you can see the Sandy Bridges’ power consumption compared to other processors.
- CPU 100% Full-load
- Idle
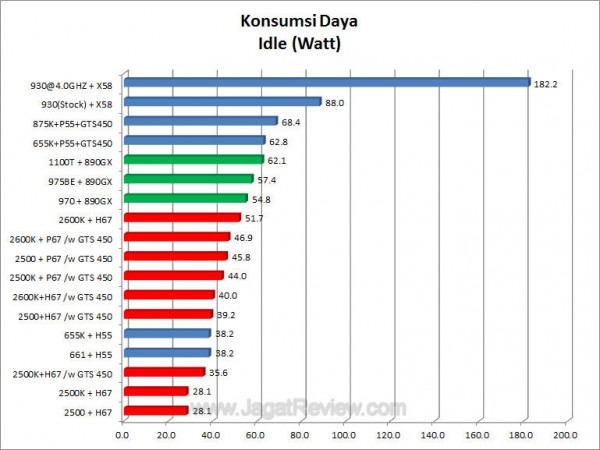
- (Intel Core i7 2600K, Core i5 2500K, Core i5 2500=Red Bars)
- (Intel Core i7 930, Core i7 875K; Core i5 661; Core i5 655K=Blue Bars)
- (AMD Phenom II X4 975 BE; Phenom II X4 970 BE; Phenom II X6 1100T=Green Bars)
Tags:
Load Comments
