Review Processor Xeon E3 1225: A Powerful Alternative for Your Desktop
Test Results
In our test, we brought along the Core i7-2600K for a direct comparison with the E3-1225. The results are rather interesting.
Blender 2.49b
Blender is an open-source 3D-modelling software. Performance is measured through the amount of time needed to render a 3D object. Lower figures represent better results.
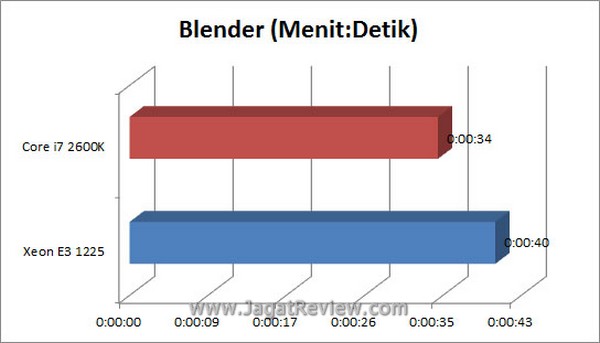
Core i7-2600K is around 11% faster than the E3-1225 in this benchmark, but that figure is relatively low considering the clockspeed difference between these two processors.
Cinebench R11.5
Cinebench benchmark calculates hardware performance in rendering a 3D scene. The final results are measured in points. Higher points mean better performance.

The Core i7-2600K is clearly superior in Cinebench, leaving a 33% performance gap between itself and the E3-1225.
Excel 2010 – Montecarlo
Surely you are well familiar with this popular spreadsheet application from Microsoft. Here, we see how fast each processor could finish the “Monte Carlo Simulation Table” in Excel 2010. The final scores are measured in seconds. Smaller figures indicate better results.
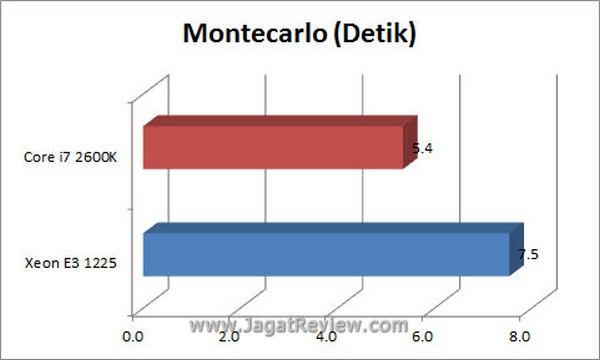
Again, it appears that the Core i7-2600K is definitely faster than the E3-1225. A 38% performance gap is very significant.
7-Zip
Another file compression software that we use as a benchmarking tool is the 7-Zip (version 9.20). This particular application is able to utilize all available threads, making it ideal to test the performance of multi-core processors. The same set of files as used in the Winzip test are also employed in this test. For our testing purposes, the file compression is carried out under three different scenarios: using 1, 2, and four threads. Results are measured in the amount of time needed to finish the process. Lower figures are better.
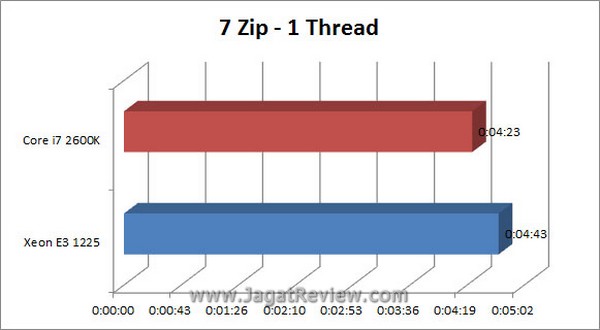
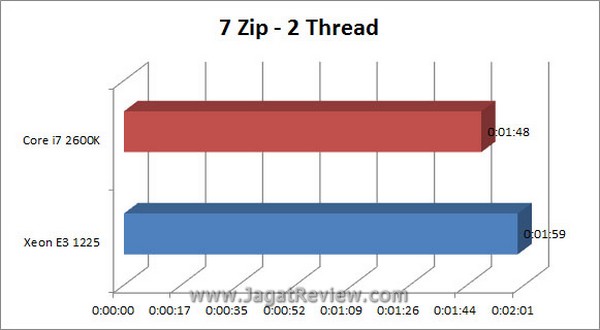
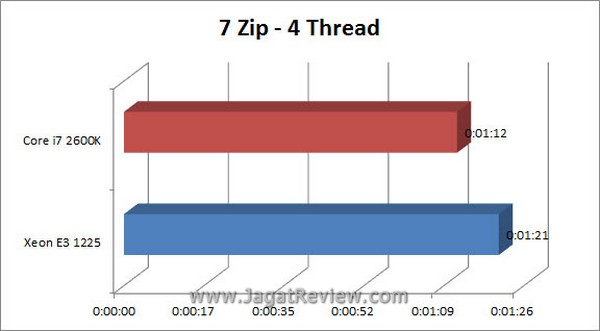
7-Zip gives off mixed results. The performance gap between Core i7-2600K and the Xeon E3-1225 widens as the number of utilized threads increases, ranging from 7% (1 thread) to 26% (4 threads).


